本文最后更新于:2022年4月24日 下午
RMarkdown为我们的数据分析创建一个清晰美观的报告,它能够包含代码,图,表,说明,查看的人能够很清楚地理解。RMarkdown利用Markdown的语法,能够被方便的转成其他类型(如html或pdf)的文件。也可以创建学术性很强的beamer,参考知乎。
1. Template
刚刚入坑,发现默认render的html会出现chunk太小,居中,浪费了大量的空白空间,当需要展示非常大的表格时,会导致页面及其不美观。另外float toc也会导致无法使用整个页面,经过大量的搜索查找,确定了自己的R markdown template,参考1,参考2,参考3 ,使用到package Hmisc ,能够实现内容充满页面,修改了显示字体,显示float toc,修改了主题:
1
2
3
4
5
6
7
8
9
10
11
12
13
14
15
16
17
18
19
20
21
22
23
24
25
26
27
28
29
30
31
32
33
34
35
36
37
38
39
40
41
42
43
44
45
| ---
title: "My title"
author: "Mengcheng Guan"
date: '`r Sys.Date()`'
output:
html_document:
toc: yes
toc_depth: 3
number_sections: true
theme: cerulean
highlight: tango
code_folding: show
description: "some description ..."
---
<style type="text/css">
body, td {
font-family: Consolas;
font-size: 14px;
}
code.r{
font-family: Consolas;
font-size: 14px;
}
pre {
font-size: 12px;
overflow-x: auto;
}
pre code {
word-wrap: normal;
white-space: pre;
}
</style>
```{r, results='hide'}
library(Hmisc)
knitrSet(lang='markdown')
```
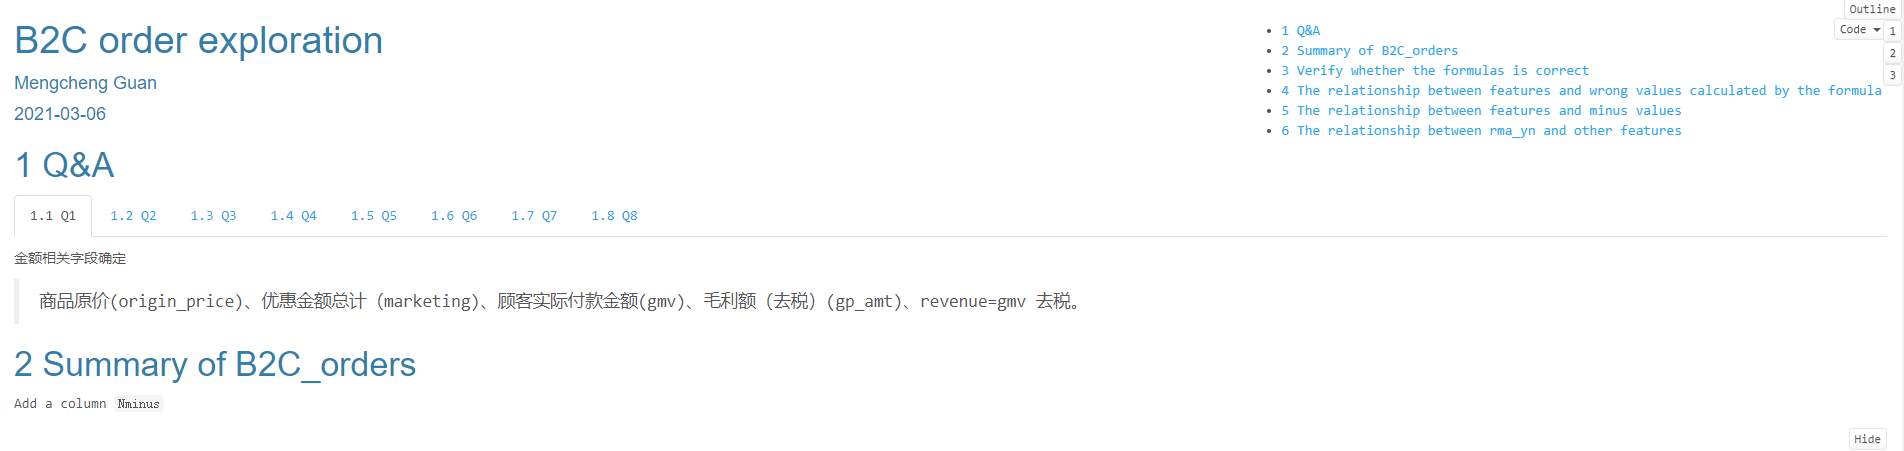
`r hidingTOC(buttonLabel="Outline")`
```{r}
```
|
注意在使用这个template的时候, YAML设置是toc需为yes,但是toc float不要设置,否则还是会造成页面左右有大量留白。浮动目录使用hidingTOC()设置,效果如下:
2. 表格美化
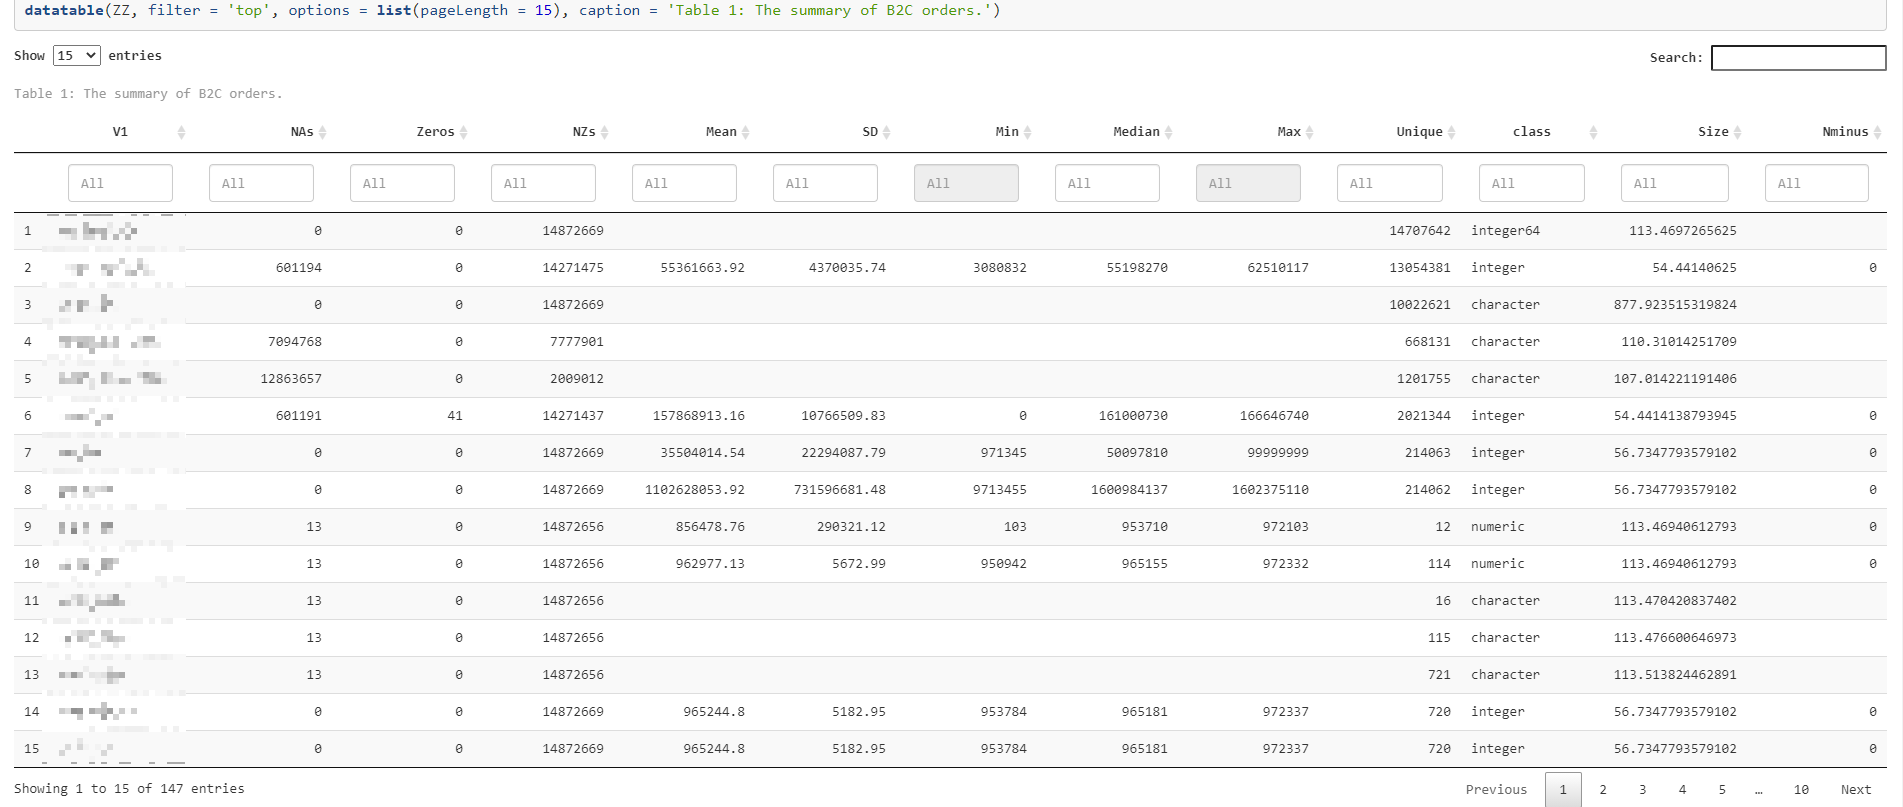
当表格行列数较多时,使用package DT,配合当前template,能实现很好的显示效果:
| library(DT)
datatable(data, filter = 'top', options = list(pageLength = 15), caption = 'Table 1: This is a title.')
|
效果如下:
3. 参数说明
eval:是否计算代码块
echo 两个选项:TRUE或FALSE,或者是数字,用来控制那些行输出,那些行不输出(echo = c(1))。
fig:控制图片大小
待补充
|
```{r,eval=FALSE, echo=FALSE,fig.width=10,fig.height=6}
```
|